Unless otherwise noted, all discussions are based on U.S. markets and U.S. monetary and fiscal policies.
Asset allocation or diversification does not guarantee a profit or protect against loss in declining markets.
No investing strategy can overcome all market volatility or guarantee future results.
The value of investments and any income from them is not guaranteed and may fall as well as rise, and an investor may not get back the amount originally invested. Investment decisions should always be made based on an investor’s specific financial needs, objectives, goals, time horizon, and risk tolerance.
Market forecasts and projections are based on current market conditions and are subject to change without notice.
Projections should not be considered a guarantee.
Equity Investing Risks
The value of investments in equity securities will fluctuate in response to general economic conditions and to changes in the prospects of particular companies and/or sectors in the economy. While growth stocks are subject to the daily ups and downs of the stock market, their long-term potential as well as their volatility can be substantial. Value investing involves the risk that the market may not recognize that securities are undervalued, and they may not appreciate as anticipated. Smaller companies tend to be more volatile and less liquid than larger companies. Small cap companies may also have more limited product lines, markets, or financial resources and typically experience a higher risk of failure than large cap companies.
Fixed-Income Investing Risks
The value of investments in fixed-income securities will change as interest rates fluctuate and in response to market movements. Generally, when interest rates rise, the prices of debt securities fall, and when interest rates fall, prices generally rise. High yield securities, sometimes called junk bonds, carry increased risks of price volatility, illiquidity, and the possibility of default in the timely payment of interest and principal. Bonds may also be subject to other types of risk, such as call, credit, liquidity, and general market risks. Longer-term debt securities are usually more sensitive to interest-rate changes; the longer the maturity of a security, the greater the effect a change in interest rates is likely to have on its price.
The credit quality of fixed-income securities in a portfolio is assigned by a nationally recognized statistical rating organization (NRSRO), such as Standard & Poor’s, Moody’s, or Fitch, as an indication of an issuer’s creditworthiness. Ratings range from ‘AAA’ (highest) to ‘D’ (lowest). Bonds rated ‘BBB’ or above are considered investment grade. Credit ratings ‘BB’ and below are lower-rated securities (junk bonds). High-yielding, non-investment-grade bonds (junk bonds) involve higher risks than investment-grade bonds. Adverse conditions may affect the issuer’s ability to pay interest and principal on these securities.
Glossary & Index Definitions
Duration is a measure of the sensitivity of the price (the value of principal) of a fixed-income investment to a change in interest rates.
The Federal Reserve System (Fed) is the central bank of the United States and is governed by the Federal Reserve Board. The Federal Open Market Committee (FOMC), the policy-setting arm of the U.S. Federal Reserve, issues projections of the rate of U.S. economic growth at the conclusion of its meetings in March, June, September, and December of each year.
The federal funds (fed funds) rate is the target interest rate set by the Fed at which commercial banks borrow and lend their excess reserves to each other overnight.
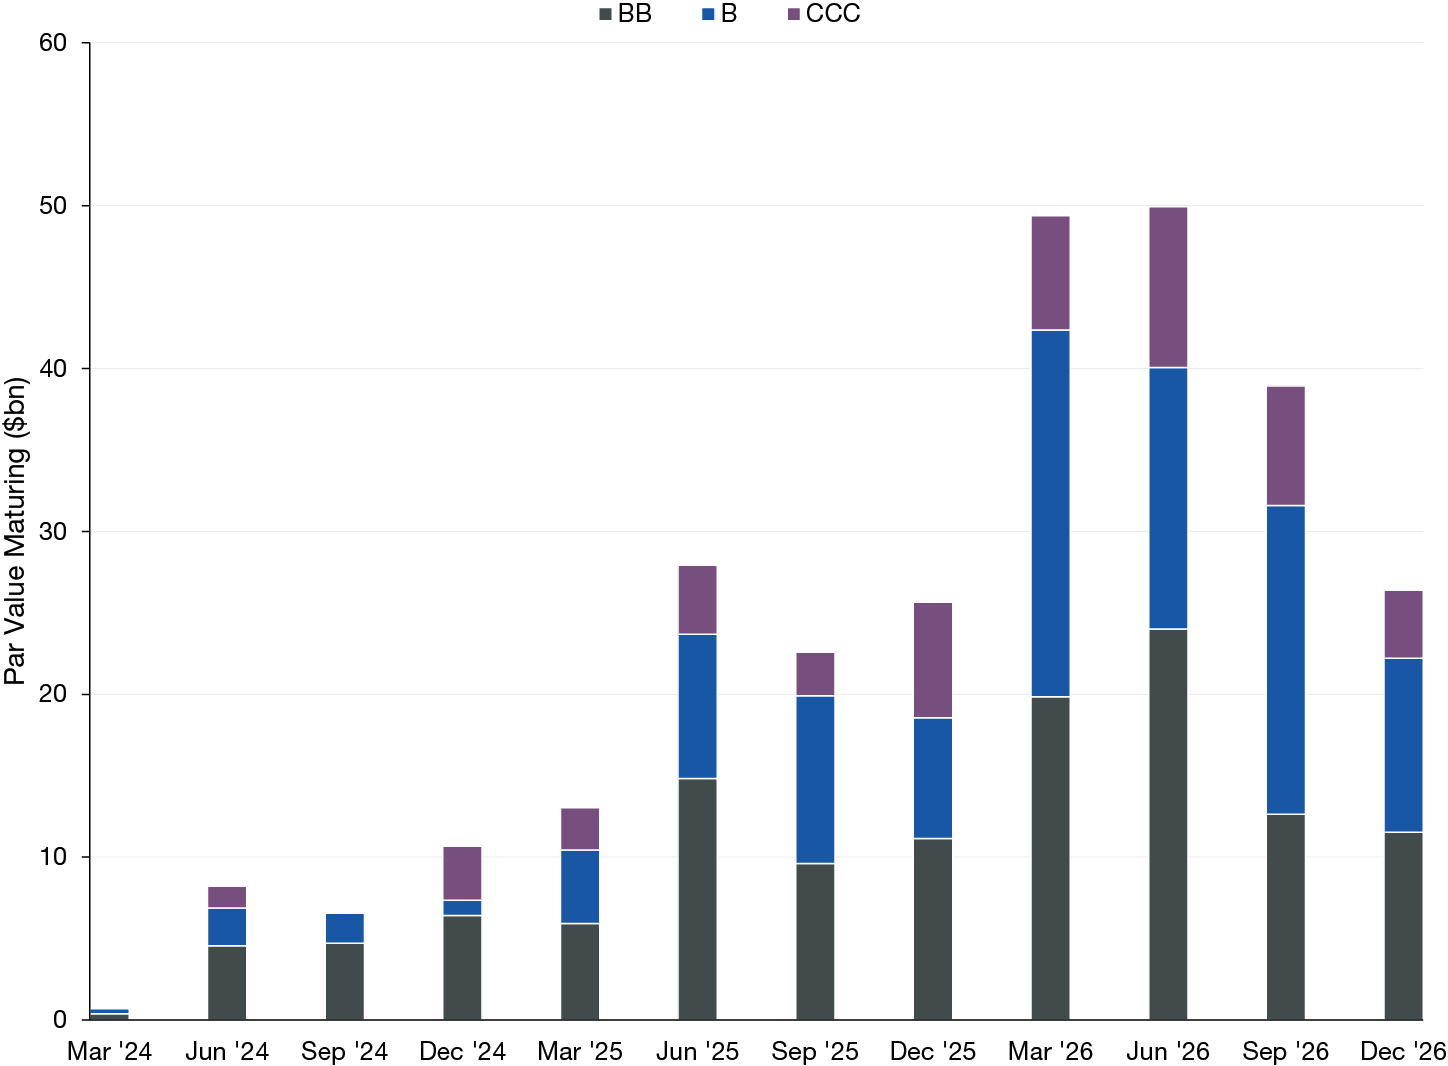
The par value of a bond, also called the face amount or face value, is the value written on the front of the bond. This is the amount of money that bond issuers promise to repay the bondholder at a future date.
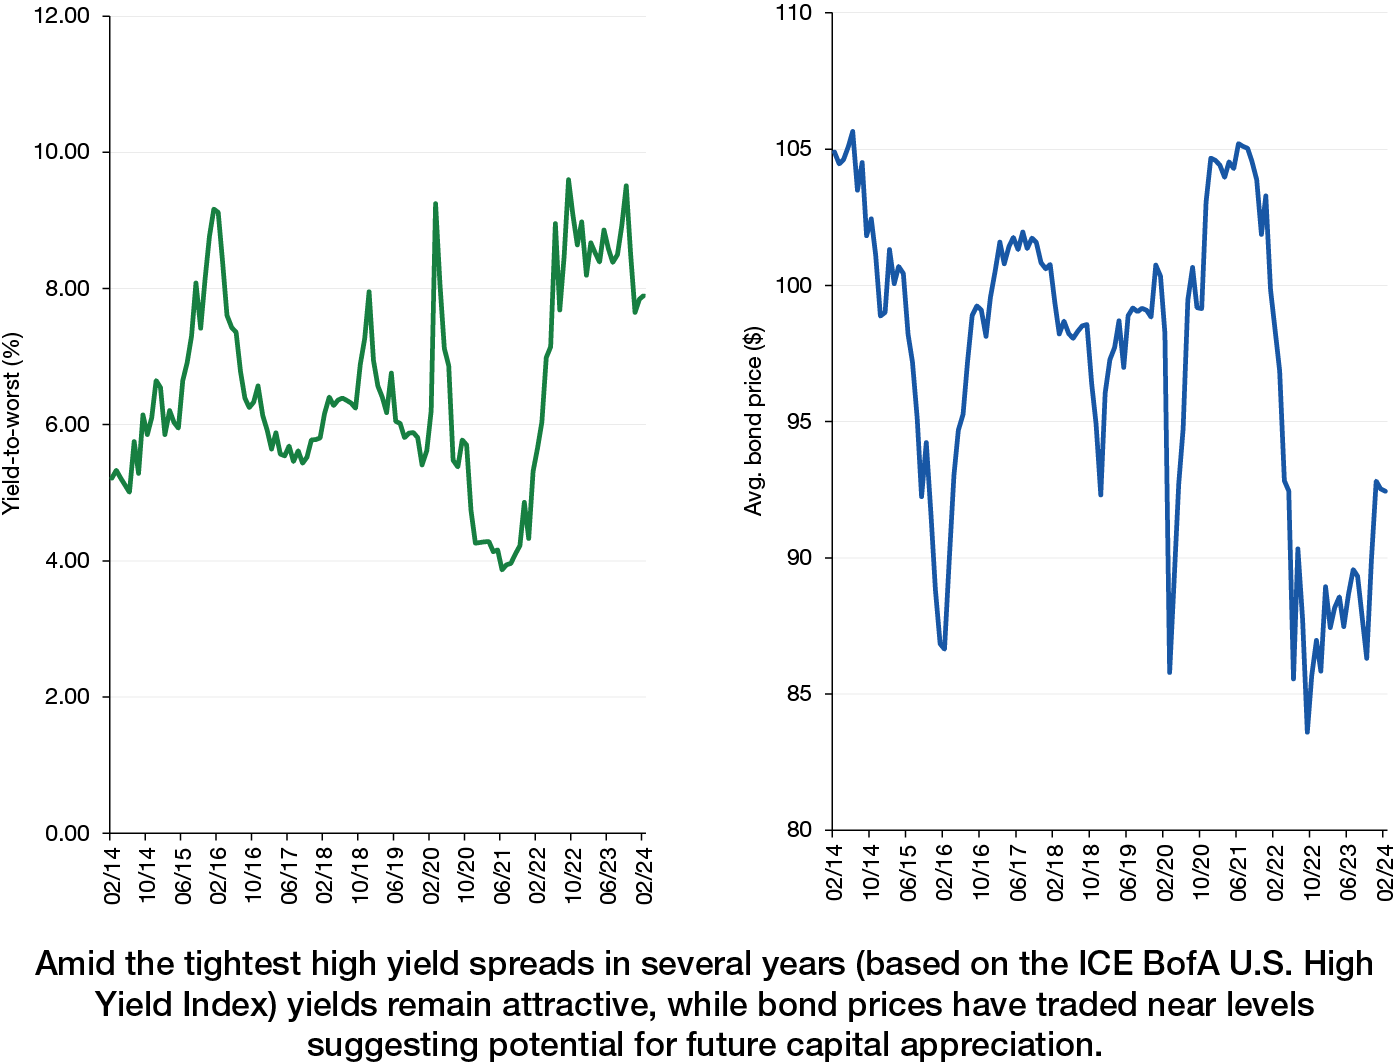
Yield is the income returned on an investment, such as the interest received from holding a security. The yield is usually expressed as an annual percentage rate based on the investment's cost, current market value, or face value. Yield-to-maturity (YTM) represents the expected return (expressed as an annualized rate) from the bond’s future cash flows, including coupon payments over the life of the bond and the bond’s principal value received at maturity. Yield-to-worst refers to the lesser of a bond’s (a) yield-to-maturity or (b) the lowest yield-to-call calculated on each scheduled call date. A corporate bond’s ‘all-in’ yield comprises the ‘risk-free’ interest rate, plus the credit spread.
Yield curve is a line that plots the interest rates, at a set point in time, of bonds having equal credit quality, but differing maturity dates. One such comparison involves the two-year and 10-year U.S. Treasury debt. This yield curve is used as a benchmark for other debt in the market, such as mortgage rates or bank lending rates. The curve is also used to predict changes in economic output and growth.
The ICE BofA U.S. High Yield Constrained Index is a capitalization-weighted index of all US dollar denominated below investment grade corporate debt publicly issued in the US domestic market. Qualifying securities must have a below investment grade rating (based on an average of Moody’s, S&P and Fitch), at least 18 months to final maturity at the time of issuance, at least one-year remaining term to final maturity as of the rebalancing date, a fixed coupon schedule and a minimum amount outstanding of $100 million.
ICE BofA Index Information:
Source: ICE Data Indices, LLC (“ICE”), used with permission. ICE PERMITS USE OF THE ICE BofA INDICES AND RELATED DATA ON AN “AS IS” BASIS, MAKES NO WARRANTIES REGARDING SAME, DOES NOT GUARANTEE THE SUITABILITY, QUALITY, ACCURACY, TIMELINESS, AND/OR COMPLETENESS OF THE ICE BofA INDICES OR ANY DATA INCLUDED IN, RELATED TO, OR DERIVED THEREFROM, ASSUMES NO LIABILITY IN CONNECTION WITH THE USE OF THE FOREGOING, AND DOES NOT SPONSOR, ENDORSE, OR RECOMMEND LORD ABBETT, OR ANY OF ITS PRODUCTS OR SERVICES.
Indexes are unmanaged, do not reflect the deduction of fees or expenses, and are not available for direct investment.
This material may contain assumptions that are “forward-looking statements,” which are based on certain assumptions of future events. Actual events are difficult to predict and may differ from those assumed. There can be no assurance that forward-looking statements will materialize or that actual returns or results will not be materially different from those described here.
The views and opinions expressed are as of the date of publication, and do not necessarily represent the views of the firm as a whole. Any such views are subject to change at any time based upon market or other conditions, and Lord Abbett disclaims any responsibility to update such views. Lord Abbett cannot be responsible for any direct or incidental loss incurred by applying any of the information offered.
This material is provided for general and educational purposes only. It is not intended as an offer or solicitation for the purchase or sale of any financial instrument, or any Lord Abbett product or strategy. References to specific asset classes and financial markets are for illustrative purposes only and are not intended to be, and should not be interpreted as, recommendations or investment advice.
Please consult your investment professional for additional information concerning your specific situation.
This material is the copyright © 2024 of Lord, Abbett & Co. LLC. All Rights Reserved.
Important Information for U.S. Investors
Lord Abbett mutual funds are distributed by Lord Abbett Distributor LLC.
FOR MORE INFORMATION ON ANY LORD ABBETT FUNDS, CONTACT YOUR INVESTMENT PROFESSIONAL OR LORD ABBETT DISTRIBUTOR LLC AT 888-522-2388, OR VISIT US AT LORDABBETT.COM FOR A PROSPECTUS, WHICH CONTAINS IMPORTANT INFORMATION ABOUT A FUND'S INVESTMENT GOALS, SALES CHARGES, EXPENSES AND RISKS THAT AN INVESTOR SHOULD CONSIDER AND READ CAREFULLY BEFORE INVESTING.
The municipal bond market may be impacted by unfavorable legislative or political developments and adverse changes in the financial conditions of state and municipal issuers or the federal government in case it provides financial support to the municipality. Income from the municipal bonds held could be declared taxable because of changes in tax laws. Certain sectors of the municipal bond market have special risks that can affect them more significantly than the market as a whole. Because many municipal instruments are issued to finance similar projects, conditions in these industries can significantly affect an investment. Income from municipal bonds may be subject to the alternative minimum tax. Federal, state, and local taxes may apply. Investments in Puerto Rico and other U.S. territories, commonwealths, and possessions may be affected by local, state, and regional factors. These may include, for example, economic or political developments, erosion of the tax base, and the possibility of credit problems.
The information provided is not directed at any investor or category of investors and is provided solely as general information about Lord Abbett’s products and services and to otherwise provide general investment education. None of the information provided should be regarded as a suggestion to engage in or refrain from any investment-related course of action as neither Lord Abbett nor its affiliates are undertaking to provide impartial investment advice, act as an impartial adviser, or give advice in a fiduciary capacity. If you are an individual retirement investor, contact your financial advisor or other fiduciary about whether any given investment idea, strategy, product or service may be appropriate for your circumstances.