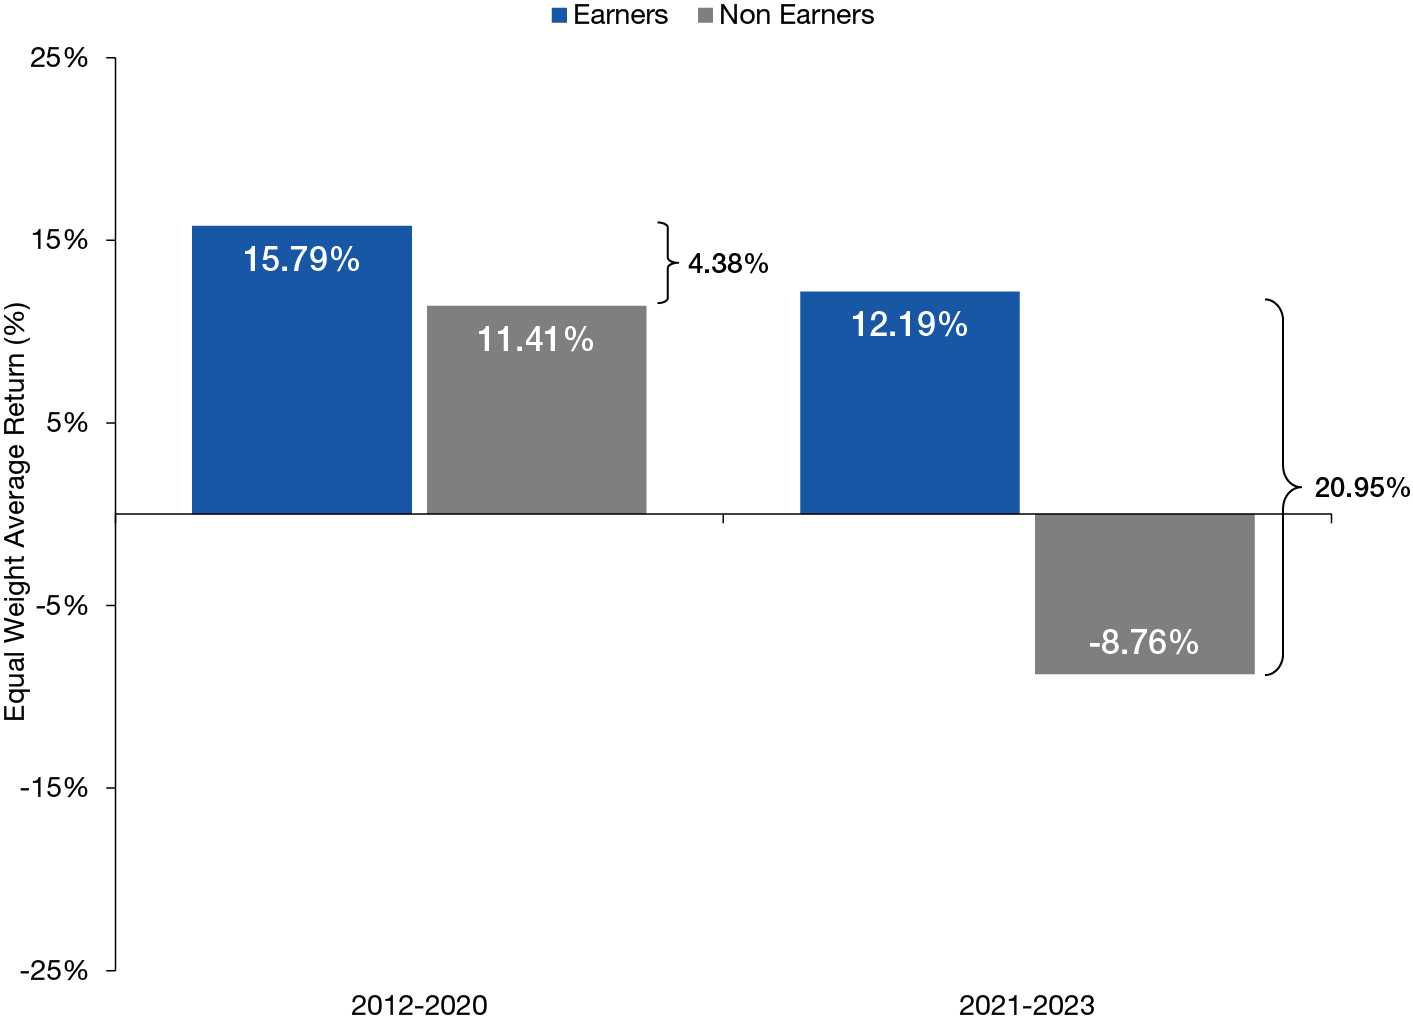
1For example, an historical analysis (2004–2022) of companies in the Russell 1000 Index in the top 10% of the R&D intensity category—those that spent the most on R&D relative to revenues—and the subsequent next three years of investment returns, showed that the highest R&D intensity companies outperformed the rest of the index by an annualized average of 18%.
Unless otherwise noted, all discussions are based on U.S. markets and U.S. monetary and fiscal policies.
References to fund yields are for informational purposes only and are not meant to represent any specific Lord Abbett bond fund or portfolio.
Asset allocation or diversification does not guarantee a profit or protect against loss in declining markets.
No investing strategy can overcome all market volatility or guarantee future results.
The value of investments and any income from them is not guaranteed and may fall as well as rise, and an investor may not get back the amount originally invested. Investment decisions should always be made based on an investor’s specific financial needs, objectives, goals, time horizon, and risk tolerance.
Market forecasts and projections are based on current market conditions and are subject to change without notice.
Projections should not be considered a guarantee.
Equity Investing Risks
The value of investments in equity securities will fluctuate in response to general economic conditions and to changes in the prospects of particular companies and/or sectors in the economy. While growth stocks are subject to the daily ups and downs of the stock market, their long-term potential as well as their volatility can be substantial. Value investing involves the risk that the market may not recognize that securities are undervalued, and they may not appreciate as anticipated. Smaller companies tend to be more volatile and less liquid than larger companies. Small cap companies may also have more limited product lines, markets, or financial resources and typically experience a higher risk of failure than large cap companies.
Fixed-Income Investing Risks
The value of investments in fixed-income securities will change as interest rates fluctuate and in response to market movements. Generally, when interest rates rise, the prices of debt securities fall, and when interest rates fall, prices generally rise. High yield securities, sometimes called junk bonds, carry increased risks of price volatility, illiquidity, and the possibility of default in the timely payment of interest and principal. Bonds may also be subject to other types of risk, such as call, credit, liquidity, and general market risks. Longer-term debt securities are usually more sensitive to interest-rate changes; the longer the maturity of a security, the greater the effect a change in interest rates is likely to have on its price.
The credit quality of fixed-income securities in a portfolio is assigned by a nationally recognized statistical rating organization (NRSRO), such as Standard & Poor’s, Moody’s, or Fitch, as an indication of an issuer’s creditworthiness. Ratings range from ‘AAA’ (highest) to ‘D’ (lowest). Bonds rated ‘BBB’ or above are considered investment grade. Credit ratings ‘BB’ and below are lower-rated securities (junk bonds). High-yielding, non-investment-grade bonds (junk bonds) involve higher risks than investment-grade bonds. Adverse conditions may affect the issuer’s ability to pay interest and principal on these securities.
Glossary & Index Definitions
Debt-to-equity ratio represents a company’s total liabilities divided by its equity (its book value, or its assets minus its liabilities).
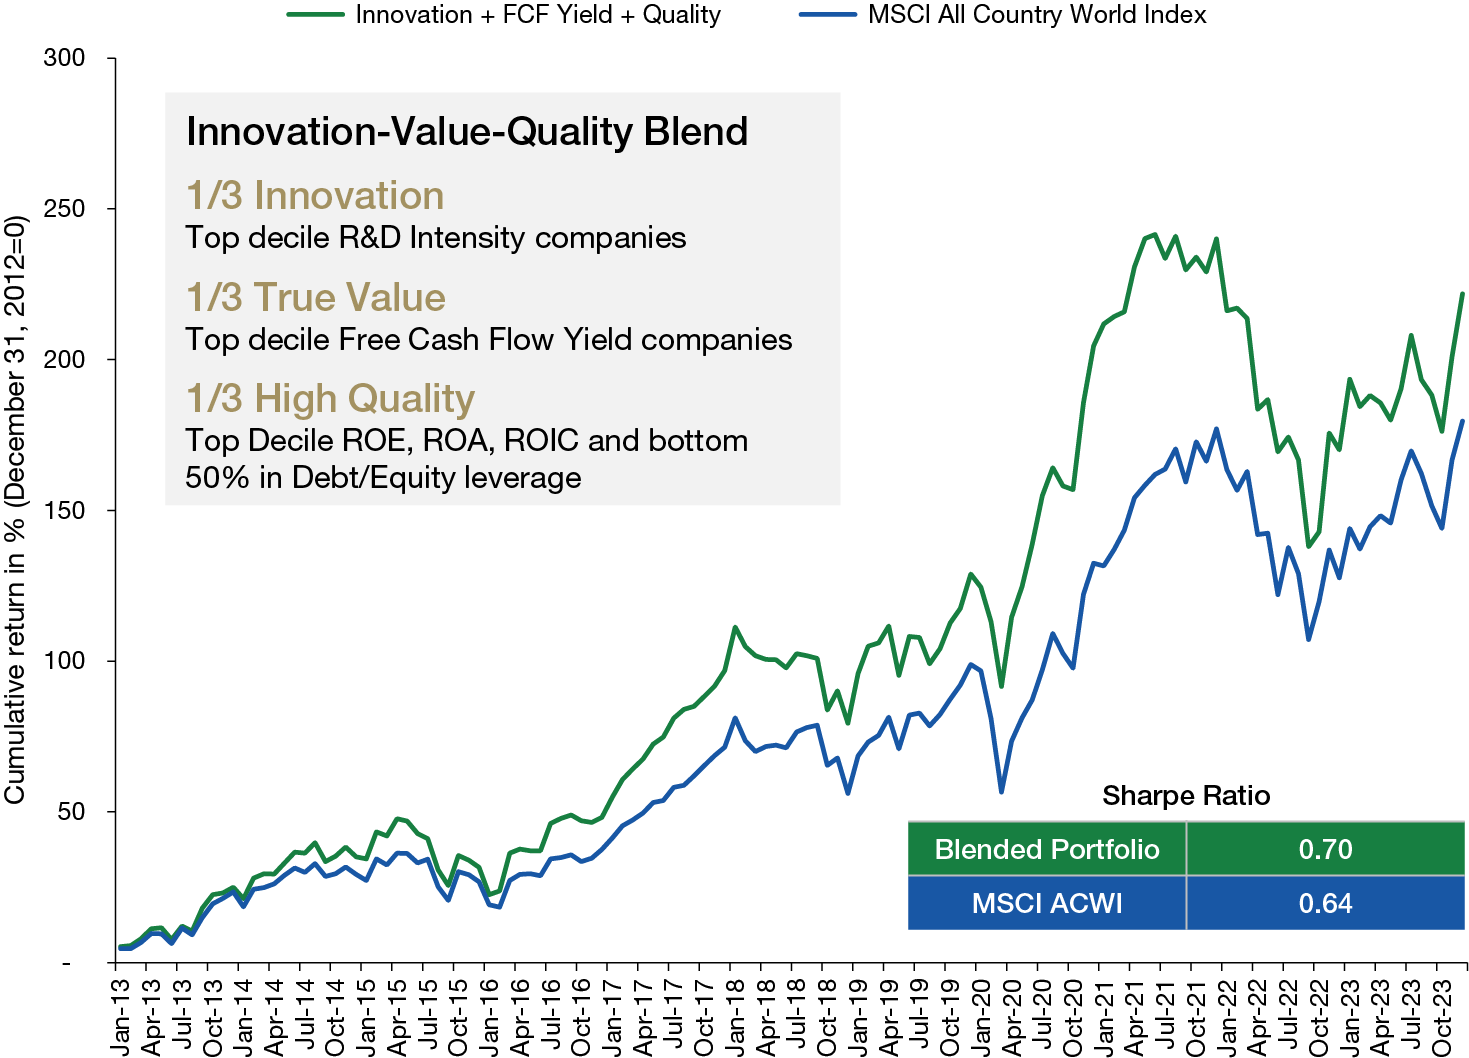
Free cash flow (FCF) is a company's available cash repaid to creditors and as dividends and interest to investors. Free cash flow yield is the free cash flow per share divided by the market price per share of a company.
Those with a hawkish view of monetary policy are focused on inflation. They favor raising interest rates to restrict the supply of money. Dovish monetary policy supports economic growth and aims to achieve maximum employment. It seeks to lower interest rates or keep them low, because loose monetary policy increases the money supply.
Return on equity is the measure of a company’s annual return (net income) divided by the value of its total shareholders’ equity, expressed as a percentage.
Return on assets is the measure of a company’s net income divided by (i) its average assets or (ii) its end-of-period assets.
Return on invested capital is calculated by taking into account the cost of the investment and the returns generated. Returns are all the earnings acquired after taxes but before interest is paid. The value of an investment is calculated by subtracting all current long-term liabilities, those due within the year, from the company’s assets.
The Sharpe ratio was developed by Nobel laureate William F. Sharpe as a measure of risk-adjusted performance. It is calculated by taking an asset class’s (or portfolio’s) excess return above the risk-free rate and dividing it by the standard deviation of its returns. The greater the Sharpe ratio, the better the risk-adjusted performance has been.
The MSCI ACWI (All Country World Index) is a free float-adjusted market capitalization weighted index that is designed to measure the equity market performance of developed and emerging markets.
The S&P 500® Index is widely regarded as the standard for measuring large cap U.S. stock market performance and includes a representative sample of leading companies in leading industries.
Indexes are unmanaged, do not reflect the deduction of fees or expenses, and are not available for direct investment.
This material may contain assumptions that are “forward-looking statements,” which are based on certain assumptions of future events. Actual events are difficult to predict and may differ from those assumed. There can be no assurance that forward-looking statements will materialize or that actual returns or results will not be materially different from those described here.
The views and opinions expressed are as of the date of publication, and do not necessarily represent the views of the firm as a whole. Any such views are subject to change at any time based upon market or other conditions, and Lord Abbett disclaims any responsibility to update such views. Lord Abbett cannot be responsible for any direct or incidental loss incurred by applying any of the information offered.
This material is provided for general and educational purposes only. It is not intended as an offer or solicitation for the purchase or sale of any financial instrument, or any Lord Abbett product or strategy. References to specific asset classes and financial markets are for illustrative purposes only and are not intended to be, and should not be interpreted as, recommendations or investment advice.
Please consult your investment professional for additional information concerning your specific situation.
This material is the copyright © 2024 of Lord, Abbett & Co. LLC. All Rights Reserved.
Important Information for U.S. Investors
Lord Abbett mutual funds are distributed by Lord Abbett Distributor LLC.
FOR MORE INFORMATION ON ANY LORD ABBETT FUNDS, CONTACT YOUR INVESTMENT PROFESSIONAL OR LORD ABBETT DISTRIBUTOR LLC AT 888-522-2388, OR VISIT US AT LORDABBETT.COM FOR A PROSPECTUS, WHICH CONTAINS IMPORTANT INFORMATION ABOUT A FUND'S INVESTMENT GOALS, SALES CHARGES, EXPENSES AND RISKS THAT AN INVESTOR SHOULD CONSIDER AND READ CAREFULLY BEFORE INVESTING.
The information provided is not directed at any investor or category of investors and is provided solely as general information about Lord Abbett’s products and services and to otherwise provide general investment education. None of the information provided should be regarded as a suggestion to engage in or refrain from any investment-related course of action as neither Lord Abbett nor its affiliates are undertaking to provide impartial investment advice, act as an impartial adviser, or give advice in a fiduciary capacity. If you are an individual retirement investor, contact your financial advisor or other fiduciary about whether any given investment idea, strategy, product or service may be appropriate for your circumstances.
Important Information for non-U.S. Investors
Note to Switzerland Investors: In Switzerland, the Representative is ACOLIN Fund Services AG, Leutschenbachstrasse 50, CH-8050 Zurich, whilst the Paying Agent is Bank Vontobel Ltd., Gotthardstrasse 43, CH- 8022 Zurich. The prospectus, the key information documents or the key investor information documents, the instrument of incorporation, as well as the annual and semi-annual reports may be obtained free of charge from the representative. In respect of the units offered in Switzerland, the place of performance is at the registered office of the representative. The place of jurisdiction shall be at the registered office of the representative or at the registered office or domicile of the investor.
Note to European Investors: This communication is issued in the United Kingdom and distributed throughout the European Union by Lord Abbett (Ireland) Limited, UK Branch and throughout the United Kingdom by Lord Abbett (UK) Ltd. Both Lord Abbett (Ireland) Limited, UK Branch and Lord Abbett (UK) Ltd are authorized and regulated by the Financial Conduct Authority.
A decision may be taken at any time to terminate the arrangements made for the marketing of the Fund in any EEA Member State in which it is currently marketed. In such circumstances, Shareholders in the affected EEA Member State will be notified of this decision and will be provided with the opportunity to redeem their shareholding in the Fund free of any charges or deductions for at least 30 working days from the date of such notification.
Lord Abbett (Middle East) Limited is authorised and regulated by the Dubai Financial Services Authority (“DFSA”). The entire content of this document is subject to copyright with all rights reserved. This research and the information contained herein may not be reproduced, distributed or transmitted in any jurisdiction or to any other person or incorporated in any way into another document or other material without our prior written consent. This document is directed at Professional Clients and not Retail Clients. Any other persons in receipt of this document must not rely upon or otherwise act upon it. This document is provided for informational purposes only. Nothing in this document should be construed as a solicitation or offer, or recommendation, to acquire or dispose of any investment or to engage in any other transaction. Nothing contained in this document constitutes an investment, an offer to invest, legal, tax or other advice or guidance and should be disregarded when considering or making investment decisions.