Unless otherwise noted, all discussions are based on U.S. markets, U.S. monetary and fiscal policies, and U.S. dollar-denominated index and return data.
Asset allocation or diversification does not guarantee a profit or protect against loss in declining markets.
No investing strategy can overcome all market volatility or guarantee future results.
The value of investments and any income from them is not guaranteed and may fall as well as rise, and an investor may not get back the amount originally invested. Investment decisions should always be made based on an investor’s specific financial needs, objectives, goals, time horizon, and risk tolerance.
Market forecasts and projections are based on current market conditions and are subject to change without notice. Projections should not be considered a guarantee.
Equity Investing Risks
The value of investments in equity securities will fluctuate in response to general economic conditions and to changes in the prospects of companies and/or sectors in the economy. While growth stocks are subject to the daily ups and downs of the stock market, their long-term potential as well as their volatility can be substantial. Value investing involves the risk that the market may not recognize that securities are undervalued, and they may not appreciate as anticipated. Smaller companies tend to be more volatile and less liquid than larger companies. Small cap companies may also have more limited product lines, markets, or financial resources and typically experience a higher risk of failure than large cap companies.
Fixed-Income Investing Risks
The value of investments in fixed-income securities will change as interest rates fluctuate and in response to market movements. Generally, when interest rates rise, the prices of debt securities fall, and when interest rates fall, prices generally rise. High yield securities, sometimes called junk bonds, carry increased risks of price volatility, illiquidity, and the possibility of default in the timely payment of interest and principal. Bonds may also be subject to other types of risk, such as call, credit, liquidity, and general market risks. Longer-term debt securities are usually more sensitive to interest-rate changes; the longer the maturity of a security, the greater the effect a change in interest rates is likely to have on its price.
The credit quality of fixed-income securities in a portfolio is assigned by a nationally recognized statistical rating organization (NRSRO), such as Standard & Poor’s, Moody’s, or Fitch, as an indication of an issuer’s creditworthiness. Ratings range from ‘AAA’ (highest) to ‘D’ (lowest). Bonds rated ‘BBB’ or above are considered investment grade. Credit ratings ‘BB’ and below are lower-rated securities (junk bonds). High-yielding, non-investment-grade bonds (junk bonds) involve higher risks than investment-grade bonds. Adverse conditions may affect the issuer’s ability to pay interest and principal on these securities.
This material may contain assumptions that are “forward-looking statements,” which are based on certain assumptions of future events. Actual events are difficult to predict and may differ from those assumed. There can be no assurance that forward-looking statements will materialize or that actual returns or results will not be materially different from those described here.
The views and opinions expressed are as of the date of publication, and do not necessarily represent the views of the firm as a whole. Any such views are subject to change at any time based upon market or other conditions and Lord Abbett disclaims any responsibility to update such views. Lord Abbett cannot be responsible for any direct or incidental loss incurred by applying any of the information offered.
This material is provided for general and educational purposes only. It is not intended as an offer or solicitation for the purchase or sale of any financial instrument, or any Lord Abbett product or strategy. References to specific asset classes and financial markets are for illustrative purposes only and are not intended to be, and should not be interpreted as, recommendations or investment advice.
Certain information contained herein has been obtained from third party sources and such information has not been independently verified by Lord Abbett. No representation, warranty, or undertaking, expressed or implied, is given to the accuracy or completeness of such information by Lord Abbett or any other person. While such sources are believed to be reliable, Lord Abbett does not assume any responsibility for the accuracy or completeness of such information. Lord Abbett does not undertake any obligation to update the information contained herein as of any future date.
Please consult your investment professional for additional information concerning your specific situation.
Glossary & Index Definitions
Bloomberg U.S. Aggregate Index represents securities that are SEC-registered, taxable, and dollar denominated. The index covers the U.S. investment grade fixed rate bond market, with index components for government and corporate securities, mortgage pass-through securities, and asset-backed securities. These major sectors are subdivided into more specific indices that are calculated and reported on a regular basis.
Bloomberg High Yield Bond Index covers the universe of fixed rate, non-investment grade debt. Eurobonds and debt issues from countries designated as emerging markets (sovereign rating of Baa1/BBB+/BBB+ and below using the middle of Moodys, S&P, and Fitch) are excluded, but Canadian and global bonds (SEC registered) of issuers in non-EMG countries are included. Original issue zeroes, step-up coupon structures, 144-As and pay-in-kind bonds (PIKs, as of October 1, 2009) are also included.
Bloomberg U.S. Corporate Index covers publicly issued, investment-grade U.S. corporate and specified foreign debentures and secured notes that meet the specified maturity, liquidity, and quality requirements. To qualify, bonds must be SEC-registered.
Bloomberg High Yield BB-rated Index is the BB-rated component of the Bloomberg High Yield Bond Index.
Bloomberg High Yield B-rated Index is the B-rated component of the Bloomberg High Yield Bond Index.
Bloomberg MBS Index covers the mortgage-backed pass-through securities of Ginnie Mae (GNMA), Fannie Mae (FNMA), and Freddie Mac (FHLMC). The MBS Index is formed by grouping the universe of over 600,000 individual fixed rate MBS pools into approximately 3,500 generic aggregates.
Quantitative easing refers to a monetary policy action where a central bank purchases predetermined amounts of government bonds or other financial securities/assets in order to stimulate economic activity.
Treasuries are debt securities issued by the U.S. government and secured by its full faith and credit. Income from Treasury securities is exempt from state and local taxes. Although U.S. government securities are guaranteed as to payments of interest and principal, their market prices are not guaranteed and will fluctuate in response to market movements.
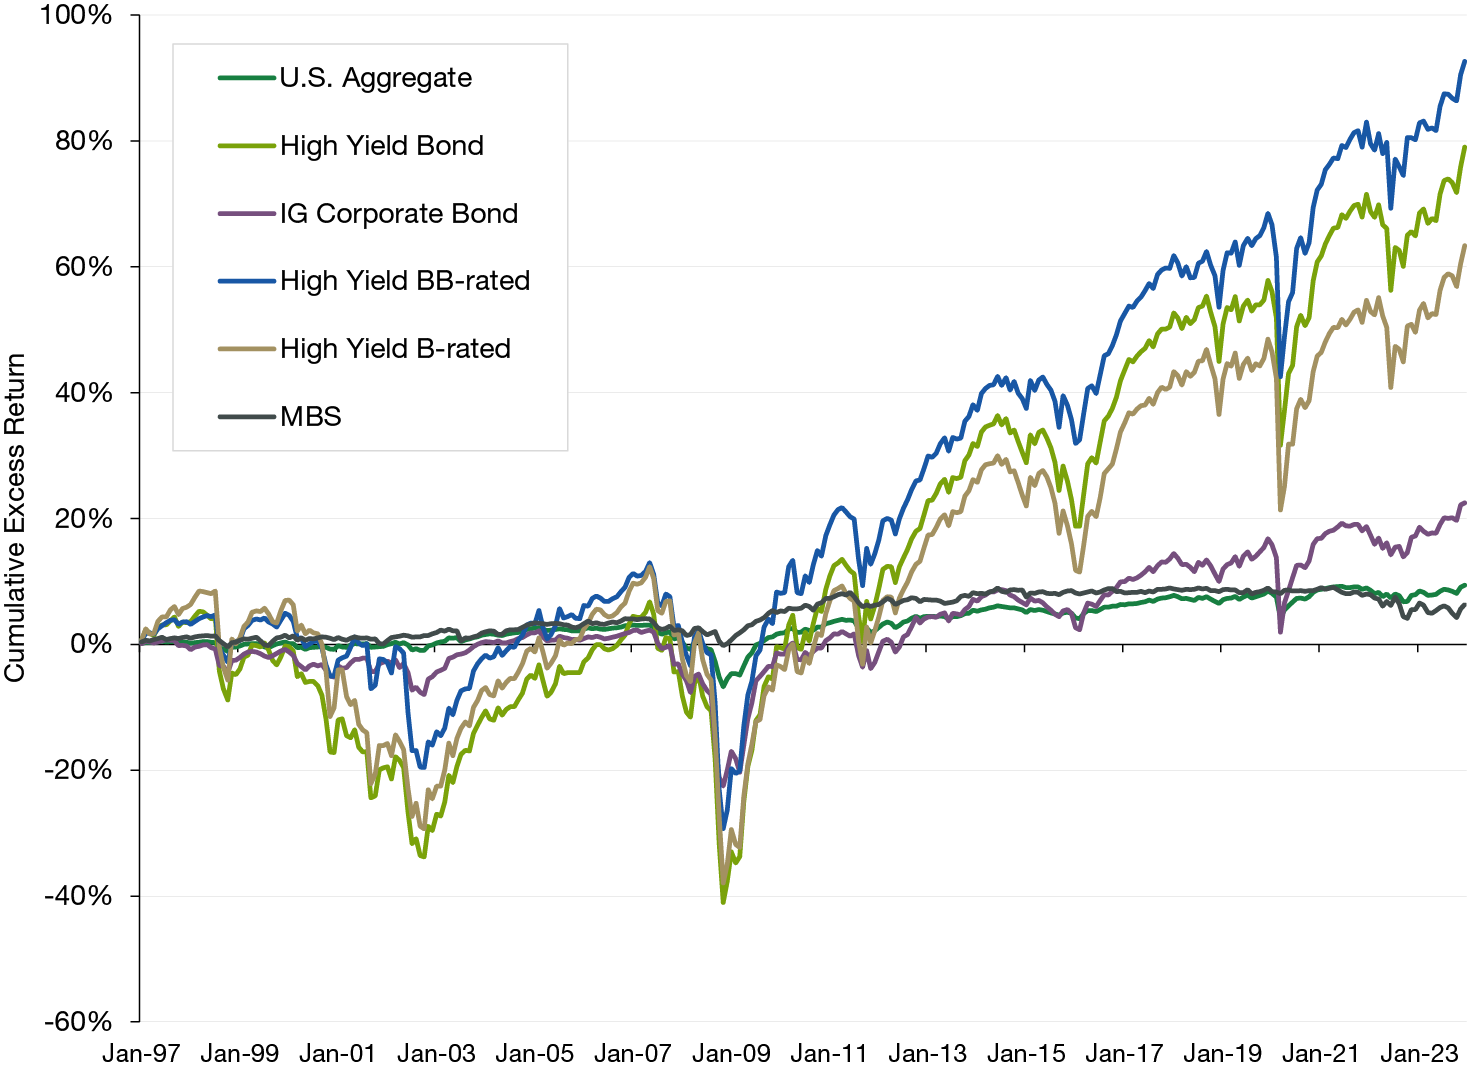
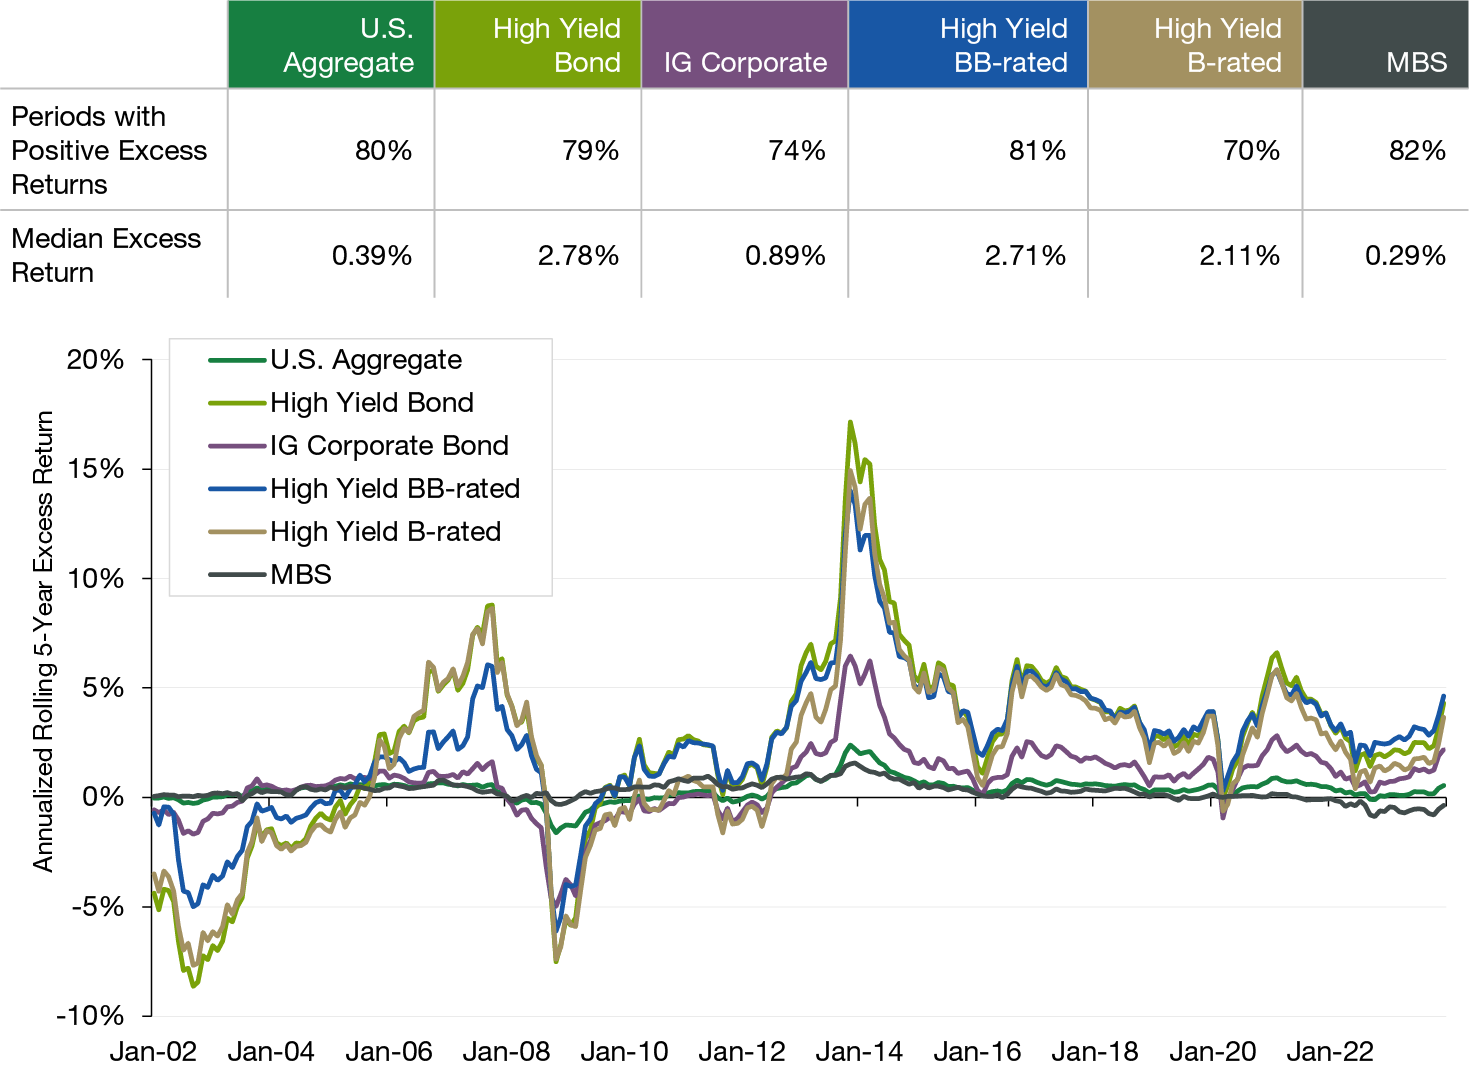
Excess returns are the return achieved by a security (or portfolio of securities) above the return of a benchmark. The risk-free rate (i.e., Treasuries) and benchmarks with similar levels of risk to the investment being analyzed are commonly used in calculating excess returns.
Real yield is the stated yield on a fixed-income investment minus the impact from inflation.
Information Ratio measures and compares the active return of an investment compared to a benchmark index relative to the volatility of the active return.
Spread is the percentage difference in current yields of various classes of fixed-income securities versus Treasury bonds or another benchmark bond measure. A bond spread is often expressed as a difference in percentage points or basis points (which equal one-one hundredth of a percentage point). The option-adjusted spread (OAS) is the measurement of the spread of a fixed-income security rate and the risk-free rate of return, which is adjusted to take into account an embedded option. Typically, an analyst uses the Treasury securities yield for the risk-free rate.
A basis point is one one-hundredth of a percentage point.
The Federal Reserve (Fed) is the central bank of the United States. The federal funds (fed funds) rate is the target interest rate set by the Fed at which commercial banks borrow and lend their excess reserves to each other overnight.
Bloomberg Index Information
Source: Bloomberg Index Services Limited. BLOOMBERG® is a trademark and service mark of Bloomberg Finance L.P. and its affiliates (collectively “Bloomberg”). Bloomberg owns all proprietary rights in the Bloomberg Indices. Bloomberg does not approve or endorse this material or guarantee the accuracy or completeness of any information herein, or make any warranty, express or implied, as to the results to be obtained therefrom and, to the maximum extent allowed by law, shall not have any liability or responsibility for injury or damages arising in connection therewith.
Indexes are unmanaged, do not reflect the deduction of fees or expenses, and are not available for direct investment.
This material is the copyright © 2024 of Lord, Abbett & Co. LLC. All Rights Reserved.
Important Information for U.S. Investors
Lord Abbett mutual funds are distributed by Lord Abbett Distributor LLC.
FOR MORE INFORMATION ON ANY LORD ABBETT FUNDS, CONTACT YOUR INVESTMENT PROFESSIONAL OR LORD ABBETT DISTRIBUTOR LLC AT 888-522-2388, OR VISIT US AT LORDABBETT.COM FOR A PROSPECTUS, WHICH CONTAINS IMPORTANT INFORMATION ABOUT A FUND'S INVESTMENT GOALS, SALES CHARGES, EXPENSES AND RISKS THAT AN INVESTOR SHOULD CONSIDER AND READ CAREFULLY BEFORE INVESTING.
The information provided is not directed at any investor or category of investors and is provided solely as general information about Lord Abbett’s products and services and to otherwise provide general investment education. None of the information provided should be regarded as a suggestion to engage in or refrain from any investment-related course of action as neither Lord Abbett nor its affiliates are undertaking to provide impartial investment advice, act as an impartial adviser, or give advice in a fiduciary capacity. If you are an individual retirement investor, contact your financial advisor or other fiduciary about whether any given investment idea, strategy, product, or service may be appropriate for your circumstances.
Important Information for non-U.S. Investors
Note to Switzerland Investors: In Switzerland, the Representative is ACOLIN Fund Services AG, Leutschenbachstrasse 50, CH-8050 Zurich, whilst the Paying Agent is Bank Vontobel Ltd., Gotthardstrasse 43, CH- 8022 Zurich. The prospectus, the key information documents or the key investor information documents, the instrument of incorporation, as well as the annual and semi-annual reports may be obtained free of charge from the representative. In respect of the units offered in Switzerland, the place of performance is at the registered office of the representative. The place of jurisdiction shall be at the registered office of the representative or at the registered office or domicile of the investor.
Note to European Investors: This communication is issued in the United Kingdom and distributed throughout the European Union by Lord Abbett (Ireland) Limited, UK Branch and throughout the United Kingdom by Lord Abbett (UK) Ltd. Both Lord Abbett (Ireland) Limited, UK Branch and Lord Abbett (UK) Ltd are authorized and regulated by the Financial Conduct Authority.
A decision may be taken at any time to terminate the arrangements made for the marketing of the Fund in any EEA Member State in which it is currently marketed. In such circumstances, Shareholders in the affected EEA Member State will be notified of this decision and will be provided with the opportunity to redeem their shareholding in the Fund free of any charges or deductions for at least 30 working days from the date of such notification.
Lord Abbett (Middle East) Limited is authorised and regulated by the Dubai Financial Services Authority (“DFSA”). The entire content of this document is subject to copyright with all rights reserved. This research and the information contained herein may not be reproduced, distributed or transmitted in any jurisdiction or to any other person or incorporated in any way into another document or other material without our prior written consent. This document is directed at Professional Clients and not Retail Clients. Any other persons in receipt of this document must not rely upon or otherwise act upon it. This document is provided for informational purposes only. Nothing in this document should be construed as a solicitation or offer, or recommendation, to acquire or dispose of any investment or to engage in any other transaction. Nothing contained in this document constitutes an investment, an offer to invest, legal, tax or other advice or guidance and should be disregarded when considering or making investment decisions.